
Protected Areas Database of the U.S.
Overview
The Protected Areas Database of the United States (PAD-US) illustrates and describes public land ownership, management and conservation lands nationally, including voluntarily provided privately protected areas. The lands included in PAD-US are assigned conservation measures that qualify their intent to manage lands for the preservation of biological diversity and to other natural, recreational and cultural uses; managed for these purposes through legal or other effective means.
Data Layer Description
Source

U.S. Geological Survey (USGS) Gap Analysis Program (GAP)
What this data layer represents
The Protected Areas Database of the United States (PAD-US) illustrates and describes public land ownership, management and conservation lands nationally, including voluntarily provided privately protected areas. The lands included in PAD-US are assigned conservation measures that qualify their intent to manage lands for the preservation of biological diversity and to other natural, recreational and cultural uses; managed for these purposes through legal or other effective means.
Location
United States
Description
- Category
- Owner Type
- Owner Name
- Local Owner
- Manager Type
- Manager Name
- Local Manager
- Designation Type
- Local Designation
- Unit Name
- Local Name
- Source
- Public Access
- GAP Status - Status 1, 2, 3 or 4
- GAP Status Description
- International Union for Conservation of Nature (IUCN) Description - I: Strict Nature Reserve, II: National Park, III: Natural Monument or Feature, IV: Habitat/Species Management Area, V: Protected Landscape/Seascape, VI: Protected area with sustainable use of natural resources, Other conservation area, Unassigned
- Date of Establishment
- Add this layer to a map in the map viewer. The layer is limited to scales of approximately 1:1,000,000 or larger but a vector tile layer created from the same data can be used at smaller scales to produce a webmap that displays across the full range of scales. The layer or a map containing it can be used in an application.
- Change the layer’s transparency and set its visibility range
- Open the layer’s attribute table and make selections and apply filters. Selections made in the map or table are reflected in the other. Center on selection allows you to zoom to features selected in the map or table and show selected records allows you to view the selected records in the table.
- Change the layer’s style and filter the data. For example, you could set a filter for Gap Status Code = 3 to create a map of only the GAP Status 3 areas.
- Add labels and set their properties
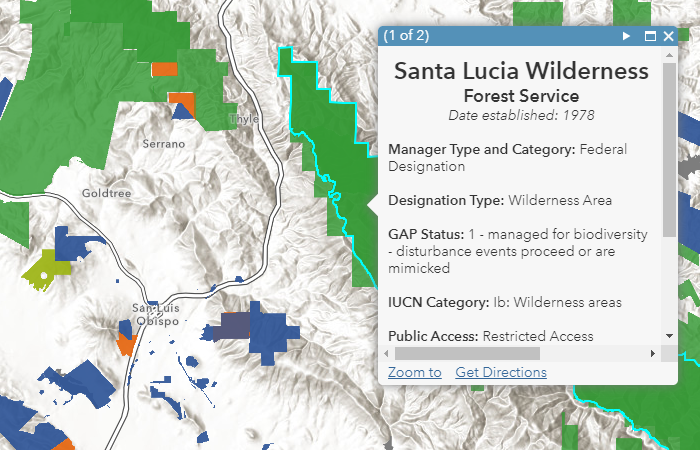
- Customize the pop-up
- Add this layer to a 2d or 3d map. The same scale limit as Online applies in Pro
- Use as an input to geoprocessing. For example, copy features allows you to select then export portions of the data to a new feature class. Note that many features in the PAD-US database overlap. For example wilderness area designations overlap US Forest Service and other federal lands. Any analysis should take this into consideration. An imagery layer created from the same data set can be used for geoprocessing analysis with larger extents and eliminates some of the complications arising from overlapping polygons.
- Change the symbology and the attribute field used to symbolize the data
- Open table and make interactive selections with the map
- Modify the pop-ups
- Apply Definition Queries to create sub-sets of the layer
How to get the data layer
The source data for this layer are available here.
How you might make use of this data layer
All information is created with a specific end use or uses in mind. This is especially true for GIS data, which is expensive to produce and must be directed to meet the immediate program needs. However, these data were created with the expectation that they would be used for other applications; therefore, we list below both appropriate and inappropriate uses. This list is in no way exhaustive but should serve as a guide to assess whether a proposed use can or cannot be supported by these data. For many uses, it is unlikely that PAD-US will provide the only data needed, and for uses with a regulatory outcome, field surveys should verify the result. In the end, it will be the responsibility of each data user to determine if these data can answer the question being asked, and if they are the best tool to answer that question.
Appropriate uses of the data: primarily as a coarse map for a large area such as a county or to provide context for finer-level maps. A general list of possible applications include:
- National, regional or statewide biodiversity planning
- National, Regional or state habitat conservation planning
- County comprehensive planning
- Large-area resource management planning
- Coarse-filter evaluation of potential impacts or benefits of major projects or plan initiatives on biodiversity, such as utility or transportation corridors, wilderness proposals, regional open space and recreation proposals, etc.
- Determining relative amounts of management responsibility for specific biological resources among land stewards to facilitate cooperative management and planning
- Basic research on regional distributions of plants and animals and to help target both specific species and geographic areas for needed research
- Environmental impact assessment for large projects or military activities
- Estimation of potential economic impacts from loss of biological resource-based activities
- Education at all levels and for both students and citizens
Inappropriate Uses
It is far easier to identify appropriate uses than inappropriate ones, however, there is a "fuzzy line" that is eventually crossed when the differences in resolution of the data, size of geographic area being analyzed, and precision of the answer required for the question are no longer compatible. Examples include:
- Using the data to map small areas (less than thousands of hectares), typically requiring mapping resolution at 1:24,000 scale and using aerial photographs or ground surveys
- Combining these data with other data finer than 1:100,000 scale to produce new hybrid maps or answer queries
- Generating specific areal measurements from the data finer than the nearest thousand hectares
- Establishing exact boundaries for regulation or acquisition
- Establishing definite occurrence or non-occurrence of any feature for an exact geographic area
- Determining abundance, health, or condition of any feature.
- Establishing a measure of accuracy of any other data by comparison with GAP data
- Altering the data in any way and redistributing them as a GAP data product
- Using the data without acquiring and reviewing the metadata and this report
How to get more information
Lisa Duarte
USGS Gap Analysis Program - University of Idaho
Stewardship Coordinator
530 South Asbury Street, Suite #1
Moscow, ID 83843
(208) 885-3013
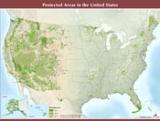
Sample Map